Articles
Features
Energy & Power
Renewables
Evaluating wind power in Ontario
April 30, 2020 | By Greg Young
Analyzing actual wind power performance in Ontario and what it means for clean energy production.
 Image: Greg Young
 Wind power in Ontario has been in the news lately, especially with the recent cancellation of a project in Prince Edward County projected to cost taxpayers $231M in cancellation fees. While this case has an obvious financial impact, it also doesn’t fit modern day environmental trends that include investing in clean energy, not cancelling it.
By downloading and analyzing public IESO data, it is possible to evaluate how wind power technology is performing in Ontario. The goal of this article is to provide insight into actual wind power performance in the province, including amount of installed wind power, energy production, seasonal characteristics of wind, and inconsistencies in wind energy output.
How wind power works
Wind turbines capture energy from the wind through their rotating blades, which then turn a generator to produce electricity. The finer detail of wind power is understanding the amount of power available to capture from the wind. These details are reviewed below.
- Wind Speed probably isn’t a huge surprise. The important aspect of wind speed is that it has a “cubic relationship” with wind power. For example, if the wind speed increases by a factor of 2, the amount of power available in the wind increases by 8! (2-cubed).
- Rotor Area is the circular area the blades cover while they are rotating. This is another fairly intuitive variable, as the larger the wind turbine, the more power it can generate. Rotor area has a 1-1 relationship with power. If the blade area doubles, power available doubles – no fancy exponents here.
- Air Density might not be as intuitive. Just like blade area, air density has a 1-1 relationship with wind power. To keep things simple, we just need to know that air is denser in cold weather (more power available), and less dense in warm weather (less power available).
To summarize, wind speed is definitely the most important variable. The second most important is likely rotor area since it can be controlled by the design engineers. Lastly, we have air density, which is location/weather specific.
Wind farms in Ontario
Wind farms are fairly scattered across Ontario, with a large concentration located in Southern Ontario.
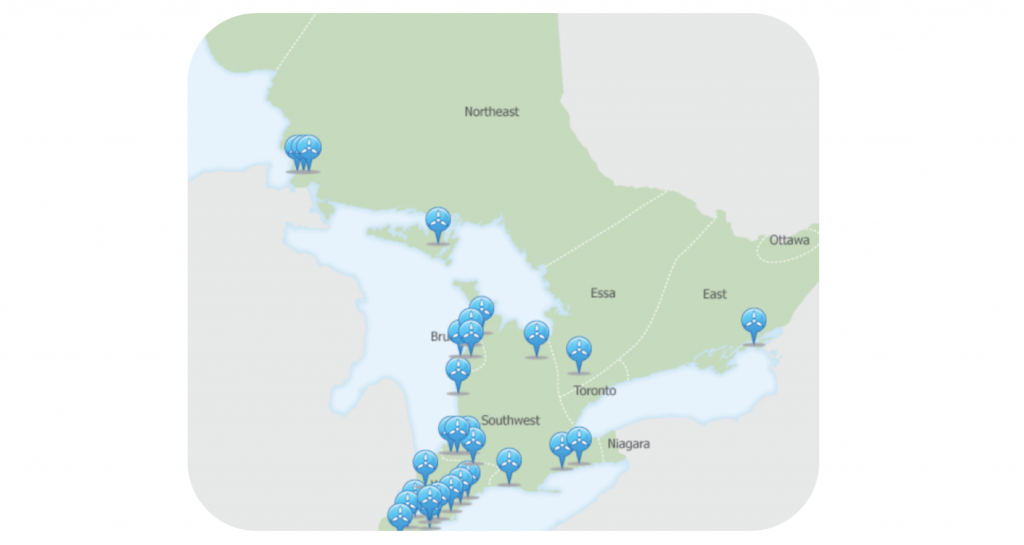
Image: http://www.ieso.ca/localContent/map/default.htm
The above is not super important to this analysis; it’s just nice to know where these wind farms are located as they aren’t a common thing we see every day. From an analysis standpoint, location is key for analyzing wind speed, but wind patterns are fairly consistent across Ontario.
Amount of installed wind power
The amount of wind power installed in the province is evaluated using two metrics: capacity (or nominal power rating of the wind turbine) and energy output. Power is an instantaneous measurement of electricity supplied to the grid, and energy has a time component, meaning for how many hours did you supply a specific amount of power. Electrical power is often measured using Watts (W), while energy is measured using Watt-hour (Wh) (energy = power x time).
The IESO provides wind power data on the transmission (high voltage) side of the grid before a local utility (like Toronto Hydro) gets involved. A breakdown of the province’s generation types, and performance numbers is shown below.
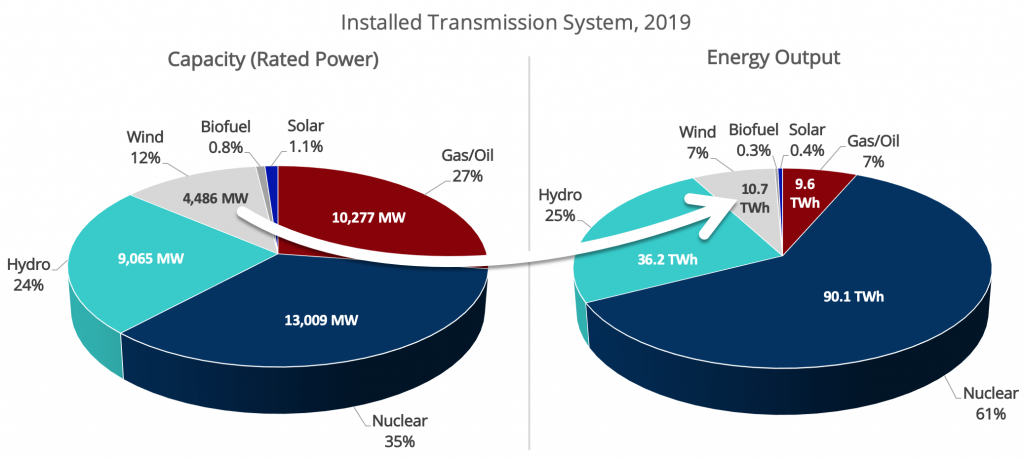
Image: Greg Young
From the above, we can see that wind is 12% of our installed capacity, yet only produces 7% of the province’s electrical energy. Alternatively, we see that nuclear is 35% capacity, yet dominates on the energy end at 61%. The reason for the capacity and energy difference is the time aspect of energy. Nuclear plants rarely shut down, so they are running 24/7. Wind power is subject to wind speed, which is inconsistent.
Wind energy output
Now we will look at actual energy output in each month of 2018 to start gauging how wind power is performing in Ontario. The monthly data from the IESO is plotted below.
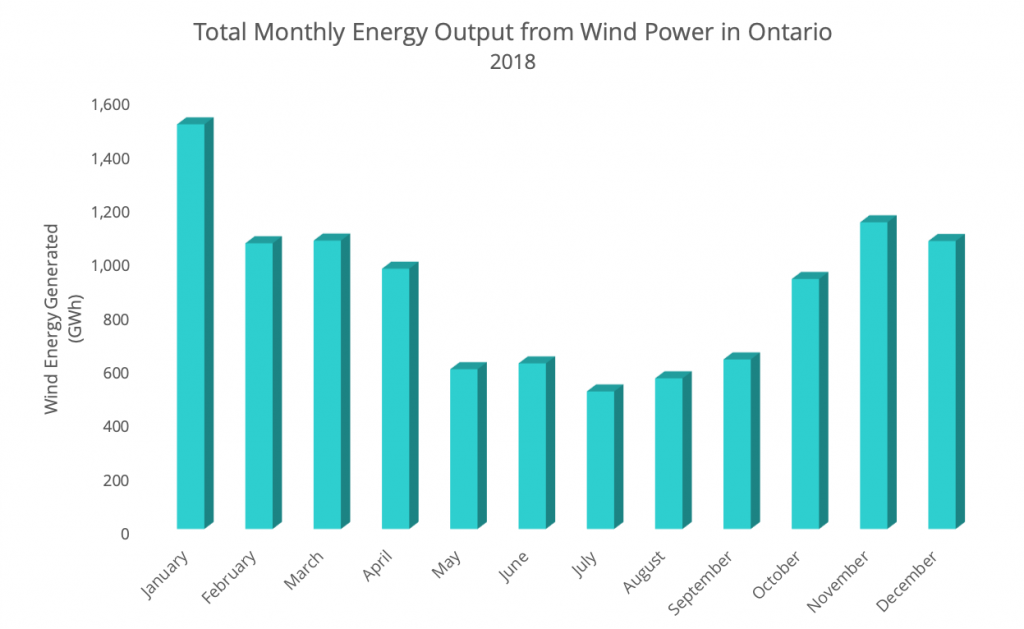
Image: Greg Young
From the above, there is a clear pattern with higher production in the “winter” months (let’s call this October to April) and much less production in the “summer” months (referred to as May to September in this article). Of the three major variables discussed previously that affect wind power, the two that are weather/location related are wind speed and air density.
Wind energy factors
The first claim we can make to describe the energy pattern visualized above is the higher air density in the winter months due to the lower temperatures, allowing for more energy to be captured.
The larger factor in this case is seasonal wind speed patterns. Below is an example of annual wind speed averages in London, Ont., an area located near to many turbines (southwest Ontario).
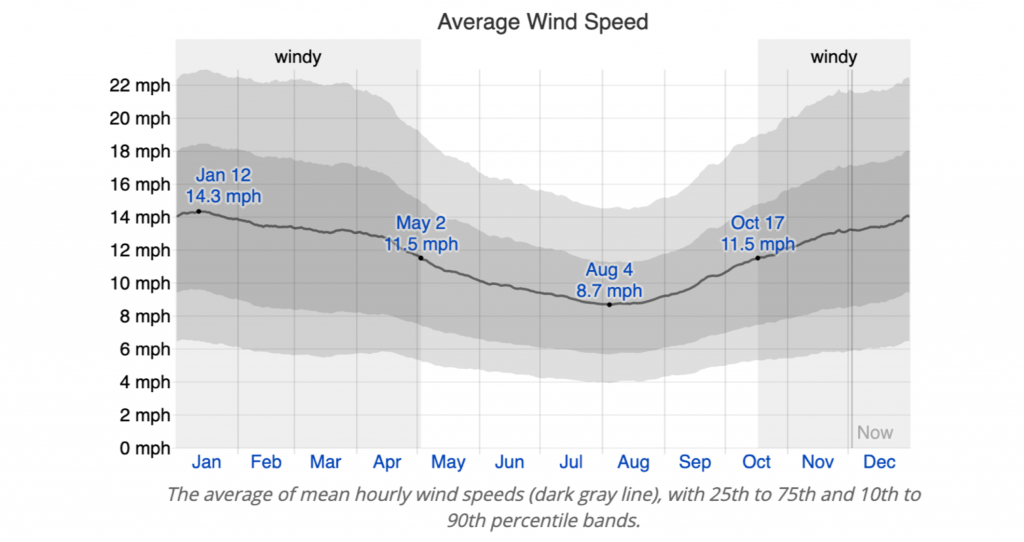
Image: https://weatherspark.com/y/18239/Average-Weather-in-London-Canada-Year-Round
We can clearly see that wind speeds in Ontario are typically higher in winter months compared to summer months, matching the same pattern in the energy output chart. Note that this similar wind pattern was seen in Toronto, Hamilton, and Windsor areas (other city data was not available from my source, but it is assumed this pattern is consistent across the province where the major wind farms are located).
Seasonal performance review
The below graphic dives deeper into a seasonal performance analysis by understanding average seasonal monthly energy production and comparing the energy output to a maximum theoretical scenario. This max scenario is developed by taking the province’s installed capacity and multiplying it by the total amount of available hours over the defined seasonal time periods.
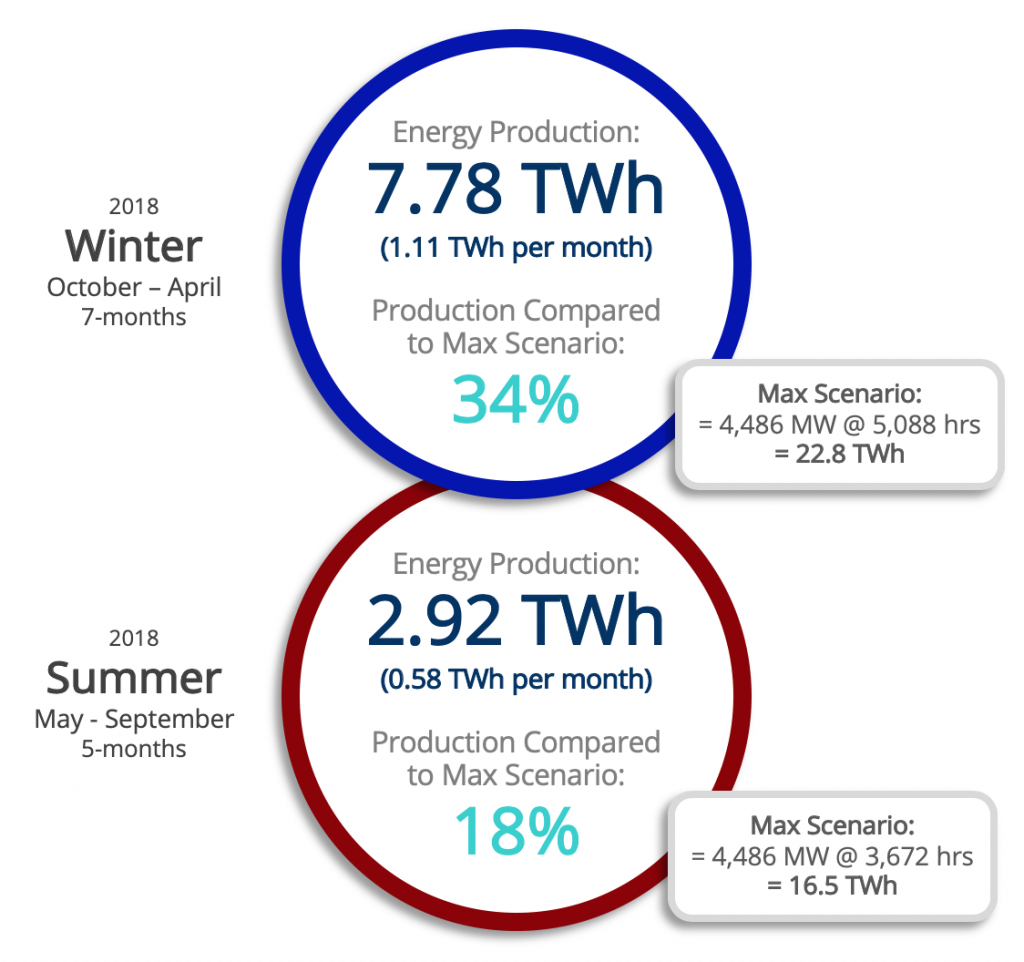
Image: Greg Young
From the above, we can see that wind energy output is nearly double in winter than summer (Winter: 1.11 TWh/mth | Summer: 0.58 TWh/mth).
If we look at the percentage numbers in the graphic, we can see that wind power in the wintertime generates 34% of the max theoretical amount it could produce, while summer lags behind at only 18%.
A clear theme is developing that during summertime, when Ontario’s demand for electricity is rising due to the increased requirement for electrical cooling, wind power is producing its least amount of energy. Of course, during this time, we have our solar panels performing at their best, but even that isn’t enough to avoid the use of natural gas peaking plants.
Inconsistencies in wind power
A lot of criticism about renewable power, especially wind and solar, revolves around their intermittent fuel sources. The wind isn’t always blowing, and the sun isn’t always shining. To outline how this effects wind power production, I have identified two sample time periods in the winter and summer of 2018 that show inconsistencies in the wind.
Winter 2018 example
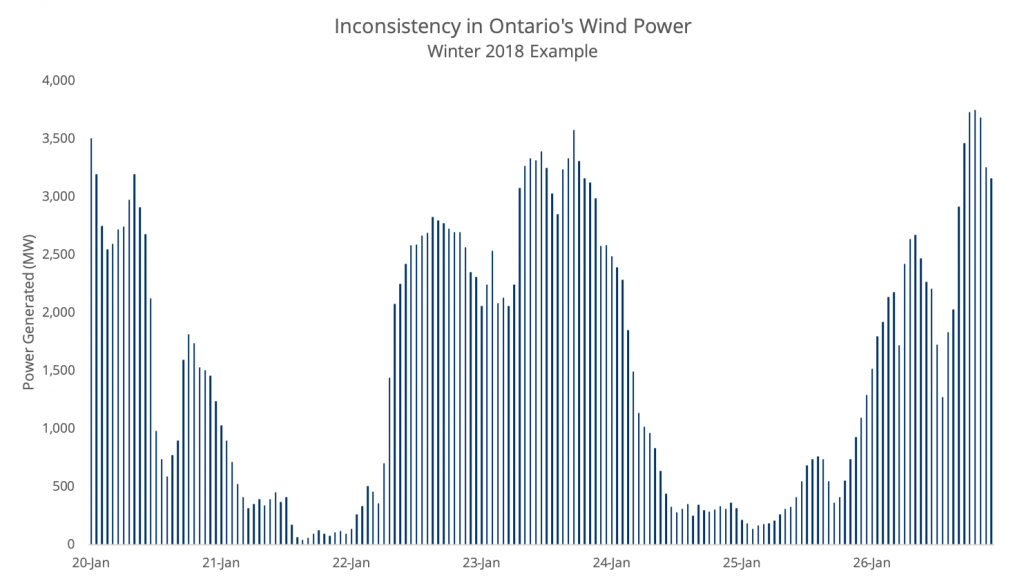
Image: Greg Young
Summer 2018 Example
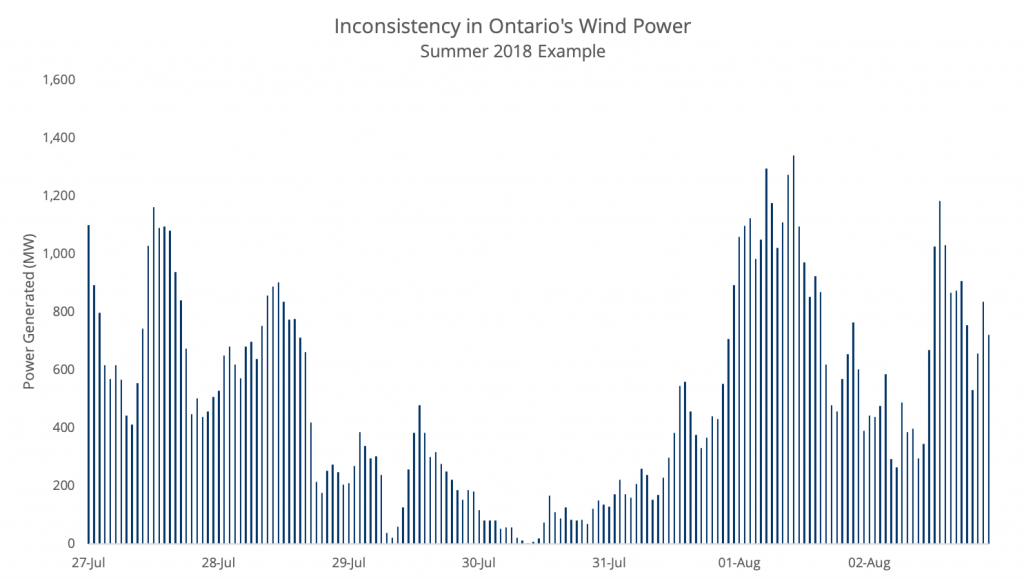
Image: Greg Young
Both examples above show how drastic wind power generation can change on an hourly and daily basis.
These clear inconsistencies with wind power is why energy storage is often cited as a key requirement to make renewable power more effective in the future.
Ontario’s wind power evaluated
We now have a good understanding of how wind power is performing in Ontario. The winter season is clearly the dominant energy producing season, and as suspected, there can be some large inconsistencies in power production on a daily basis. Hopefully the province will continue supporting wind power and monitoring industry advancements with large scale energy storage to further optimize our clean electricity grid.
Greg Young is a mechanical engineering graduate from the University of Guelph, with a specialization in sustainable energy systems. Greg now has a career in the energy industry and writes articles on various energy sector topics in his spare time.
Editor’s note: This article first appeared in the February 2020 issue of Electrical Business Magazine.
Print this page