Features
Articles
New atlas shows extent of global (light) pollution
July 11, 2016 | By Anthony Capkun
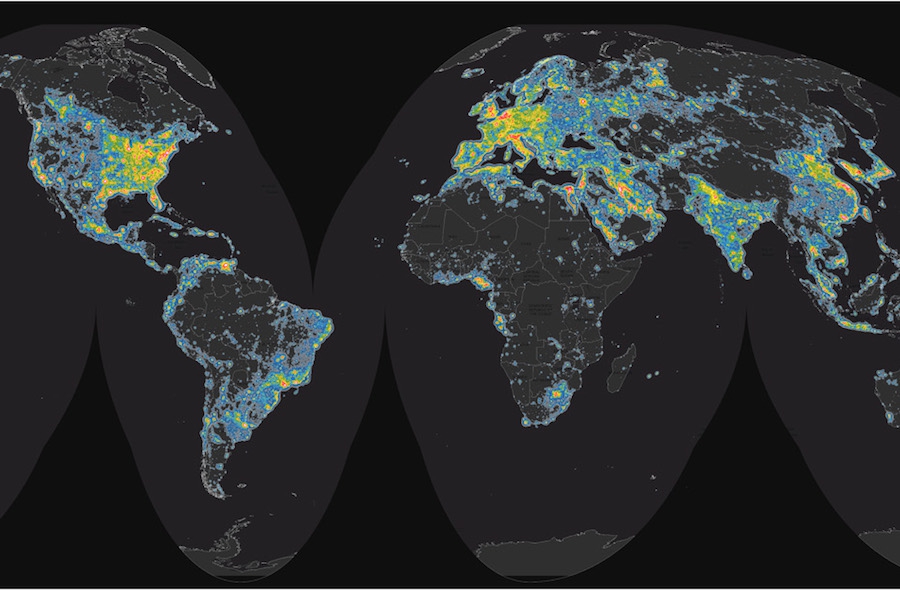 The map shows, in two-fold increasing steps, the artificial sky brightness as a ratio to the natural sky brightness (assumed to be 174 µcd/m2). Read the full study for more information. Image © the authors.
 July 11, 2016 – The just-published “New World Atlas of Artificial Night Sky Brightness” documents the degree to which the world is illuminated by artificial skyglow.
Researchers from Italy, Germany, the U.S.A. and Israel carried out the work, which was led by Fabio Falchi from the Italian Light Pollution Science & Technology Institute (ISTIL). The atlas was published in Science Advances on June 10, 2016.
“The new atlas provides a critical documentation of the state of the night environment as we stand on the cusp of a worldwide transition to LED technology,” explained Falchi. “Unless careful consideration is given to LED colour and lighting levels, this transition could unfortunately lead to a 2- to 3-fold increase in skyglow on clear nights.”
The atlas documents a world that is awash with light in many places. In Western Europe, only a few small areas remain where the night sky remains relatively unpolluted, including areas in Scotland, Sweden, Norway, and parts of Spain and Austria.
In addition to a world map, the scientists provide tables showing the area of each country and what fraction of its population live under highly light-polluted skies.
The authors specifically examined the G20 countries in terms of area, finding Italy and South Korea are the most light-polluted, and Canada and Australia the least. Residents of India and Germany are most likely to be able to see the Milky Way from their homes, while those in Saudi Arabia and South Korea are least likely.
City lighting information for the atlas came from the American Suomi NPP satellite, which includes the first instrument intentionally designed to make accurate observations of urban lights from space. The atlas was calibrated using data from ‘sky quality meters’ at 20,865 locations around the world.
The participation of citizen scientists in collecting the calibration data was critical, said Dr. Christopher Kyba, a study co-author and researcher. “Citizen scientists provided about 20% of the total data used for the calibration and, without them, we would not have had calibration data from countries outside of Europe and North America.”
PHOTO: The map shows, in two-fold increasing steps, the artificial sky brightness as a ratio to the natural sky brightness (assumed to be 174 µcd/m2). Read the full study for more information. Image © the authors.
Print this page